Sixth International Electronic Conference on Synthetic Organic Chemistry (ECSOC-6), http://www.mdpi.org/ecsoc-6, 1-30 September 2002


[C003]

Institut für Chemie
Karl-Franzens Universität Graz

Quantitative Structure - Activity Relationships for the Enantioselectivity of Oxirane Ring Opening Catalyzed by Epoxide Hydrolases

Simona Funar-Timofei,a Takahiro Suzukib, Joachim A. Paierc, Andreas Steinreiberc, Kurt Faberc and  Walter M. F. Fabianc
aInstitute of Chemistry, Romanian Academy, Bul. Mihai Vireazul 24, 1900 Timisoara, Romania
bFaculty of Economics, Toyo University, 2-11-10 Oka, Asaka, Saitama 351-8510, JAPAN
c Institut für Chemie, Karl-Franzens Universität Graz, Heinrichstr. 28, A-8010 Graz, Austria


ABSTRACT

The enantioselective ring opening catalyzed by epoxide hydrolases originating from seven different sources of a series of 2,2-disubstituted oxiranes containing alkyl chains of different lengths, unsaturated (alkenyl, alkinyl) and aromatic groups as well as electronegative atoms at various positions within the side chain was treated by quantitative structure-activity relationships. Models for the enantioselectivity were derived with the aid of multiple linear regression analysis (MLR) using several steric and electronic (quantum chemical) descriptors. Based on the models derived by MLR non-linear modeling with artificial neuronal networks (ANN) was also done. Good predictivities could be obtained by either procedure.

INTRODUCTION

Epoxide hydrolases catalyze the hydrolysis of epoxides to furnish the corresponding vicinal diols [1], allowing easy access to enantiopure compounds [2]. Preparative-scale application of these catalysts became only feasible after several microbial sources [3-5] were identified, which ensured their supply in sufficient amounts by fermentation. Bacterial epoxide hydrolases proved to be extremely flexible by exhibiting exquisite stereoselectivities over a wide substrate pattern, particularly on 2,2-disubstituted oxiranes [6-14].
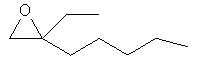
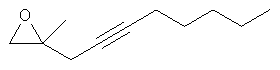
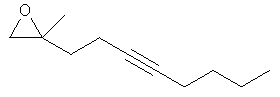
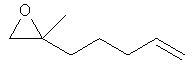
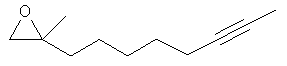
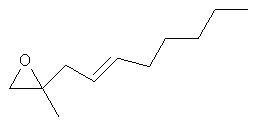
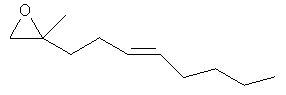
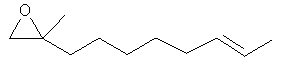
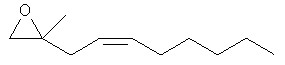
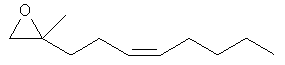
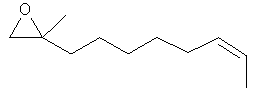
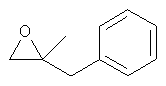
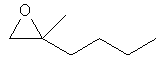
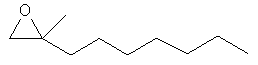
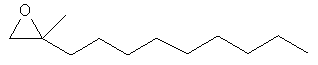
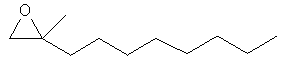
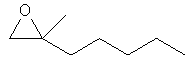
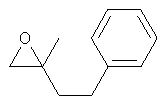
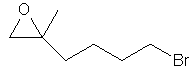
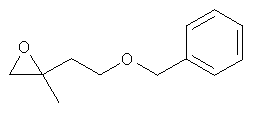
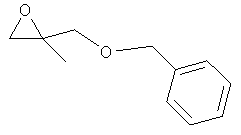
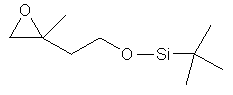
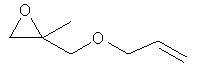
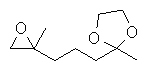
In order to facilitate the choice of the optimal epoxide hydrolase for a given substrate, i.e. substituted oxirane, we have undertaken a quantitative structure-activity relationship (QSAR) study on a series of 2,2-disubstituted epoxides (see Scheme 1 for structures) spanning a wide range of alkyl, alkenyl and aryl moieties as well as heterosubstituted thereof.

METHODS

Target properties and molecular descriptors

Experimental enantioselectivities E (for definition, see equ. (1)) measured for seven different organisms, namely Rhodococcus ruber NCIMB 11216 (A), Rhodococcus ruber DSM 43338 (B), Rhodococcus ruber DSM 44541 (C), Rhodococcus equi IFO 3730 (D), Mycobacterium paraffinicum NCIMB 10420 (E), Rhodococcus ruber DSM 44540 (F), and Rhodococcus ruber DSM 44539 (G), were taken from the literature [6-14]. As target property used to derive quantitative structure-activity relationships log E, corresponding to differences in binding free energies, was used.

Equation 1


Molecular Structures

Molecular modeling was done with the aid of the Sybyl program package [15]. The molecular structures of epoxides 1 – 24 were completely optimized using MOPAC [16] with the semiempirical AM1 Hamiltonian [17] (eigenvector following routine (EF [18]), keyword PRECISE).

Molecular Descriptors

The computer software DRAGON [19] was used to prepare descriptors. The program can calculate a variety of >800 molecular descriptors ranging from 1D to 3D descriptors such as WHIM [20]. In addition, a variety of other molecular properties, e.g., those stemming from charged partial surface areas (CPSA [21]) as well as various quantum chemical indices (see Table 1), were used. Furthermore, several other steric (e.g., the Connolly Solvent Accessible Area (SAS) [22], Connolly Molecular Surface Area, Connolly Solvent Excluded Volume (SEV) and molecular weight), hydrophobicity (ClogP) and thermodynamic descriptors (e.g., the dipole-dipole energy (Ed), torsion energy (Et) and the the sum of pairwise van der Waals interaction energy terms for atoms separated by more than 3 chemical bonds (Ev)) derived from the optimized 3D molecular structures were calculated by the Chem3D Ultra software [23]. Other steric descriptors were obtainable from the optimized 3D molecular structure included the torsion angles of the side group with respect to the oxirane ring (tor_O3C*) and the distance from the chiral carbon atom to the last (most distant) heavy atom of the chain attached to the chiral center. Therefore, initially a set of ca. 900 descriptors was generated.

Multiple linear regression (MLR) modeling

The multiple linear regression (MLR) analysis [24] has been performed by the STATISTICA software [25] SYSTAT program, from SYSTAT, Evanston, IL, USA. The leave-one-out [26] cross-validation procedure was applied to test the reliability of the models. Starting from the entire set of structural descriptors, variable selection by a stepwise regression procedure based on the Fischer test was performed. Because of the statistical quality of the obtained models, outliers have been tested by the standard residuals [24]. All the statistical tests were done at a significance level of 5 % or less. Statistical results are presented in Table 2.

Nonlinear modeling by ANN

The theory and practical applications of artificial neural networks (ANNs) in chemistry have been reviewed in depth [27]. A fully connected three-layer network was used to relate E-values for various epoxide hydrolases to a selected set of molecular descriptors as derived by the MLR modeling described above. The hidden layer contained variable nodes, and the input and hidden variables each had a bias neuron. A sigmoid transfer function was used for each neuron, and weights were adjusted iteratively by back-propagation using the generalized delta rule to minimize mean square errors between observed and calculated outputs. Input and output data were normalized between 0.1 and 0.9, and models were evaluated on the basis of correlation coefficient (r) and root-mean-square error (RMSE) [28]. To avoid network overfitting, each network was limited to a maximum of 1000 training iterations. The predictive ability of the network was also evaluated by the leave-one-out cross-validation procedure as with MLR. To highlight any "outliers” or "strong points” and to examine the model for chance correlations, the "jackknifed r” values [29,30] was used. In this method, each observation was in turn deleted from the analysis just as the leave-one-out cross validation, and the resulting correlation coefficient (rj) was noted as the jackknifed r. Thus, cases with unduly high rj values could be suspected to be "outliers”, and those with low values could be considered "influential points”. The architectures of the nets and relevant statistical parameters of the best ANN-derived model corresponding to the MLR-QSARs derived using the same molecular descriptors are listed in Table 3. For the determination of the number of hidden neurons, the values (r) for the ratio of the number of data points (training compounds) to the number of model parameters or weights should be around 2 [31]. The r values in this study are in the recommended range (1.89-3.00) as shown in Table 3. All computations were performed using our own programs, written in C language, on a microcomputer running Windows NT as its operating system.


RESULTS and DISCUSSION

QSPR models by MLR and ANN

Starting from the total set of ca. 900 potential descriptors and the variable selection procedure described above, the MLR analysis has been applied to model the enantioselectivity of the oxirane ring opening catalyzed by epoxide hydrolsases of seven different organisms. The resulting best MLR models are collected in Table 2. A few outliers were detected in the modeling except for log E (G). Higher statistical results were noticed for QSAR models of the Rhodococcus ruber DSM 44540 epoxide hydrolase. The enantioselectivity observed for oxirane ring cleavage catalyzed by this enzyme can be modeled by just three descriptors: the partial positive surface area (PPSA1), the epoxide hydrophobicity (ClogP) and the dipole-dipole energy of the epoxide (Ed). The most important contribution to the enantioselectivity is given by Ed which can be related to intramolecular electrostatic interactions within the epoxide and which has a decreasing influence. The other descriptors play a less significant role according to their relative contribution (see Table 2). PPSA1, one of the charged partial surface area (CPSA) descriptors introduced by Jurs [21], is defined as the sum of the positively charged solvent-accessible atomic surface areas in the molecule. This descriptor is expected to encode the features responsible for polar substrate – receptor interactions.
A similar model based on the PPSA1 and Ed descriptors was observed for log E of hydrolase Rhodococcus ruber DSM 11216 (A). The statistical results obtained for this hydrolase, however, are less satisfactory than that for log E of F. Similar outliers have been observed in both models: compounds E6, E19 and E22. In addition, two other outliers were noticed for the model having log E (A) as target variable: E5 and E21. Two descriptors are indicative for the observed enantioselectivity with the hydrolase of R.equi (D): the number of double bonds present in the epoxides (nDB) and the Connolly Solvent Excluded Volume (SEV). Both increase the epoxide enantioselectivity and a higher contribution of the first descriptor was noticed. Four outliers were found: epoxides E2, E11, E17 and E21.
The enantioselectivity during the epoxide reaction with the Rhodococcus ruber DSM 43338 hydrolase Bis also described by two descriptors: epoxide hardness (H), accounting for the donor electron ability of the epoxide oxygen atom and the sum of pairwise van der Waals interaction energy terms for atoms separated by more than 3 chemical bonds (Ev). The first descriptor, describing the tendency of low epoxide polarizability has a lower contribution in comparison with Ev, which describes the van der Waals epoxide intramolecular interactions. Two outliers were observed for this target variable: compounds E11 and E12. Similar statistical results were noticed in MLR models in which the target variables are log E of Mycobacterium paraffinicum NCIMB 10420 (E) and Rhodococcus ruber DSM 44539 (G). The log E (E) variable is described by four descriptors: the HOMO molecular orbital energy (EHOMO), the polar volume (MolProp-PV), hydrophobicity (ClogP) and the torsion angle tor_O3C*. The highest contribution is given by EHOMO, accounting for the electron donor ability of epoxide which increases the epoxide enantioselectivity. The hydrophobicity term can be related to the presence of alkyl chain attached to the chiral epoxide center. The torsion angle tor-O3C* is a local steric factor which contributes to the enantioselectivity. Three outliers were observed for this target variable: E2, E20 and E22.
The model describing log E of the Rhodococcus ruber DSM 44539 (G) epoxide hydrolase includes three descriptors: total surface area (MPROPAR), molecular refractivity (MR) and the torsion angle tor-O3C*. The highest contribution to the enantioselectivity is given by the MR term, accounting for the bulkiness of epoxides.
The lowest statistical results were noticed in the model with log E (C) as target variable. Three variables were included in there: the fractional partial positive surface area (FPSA1), the Connolly Surface Accessible Area (SAS) and the dipole- dipole energy (Ed). The enantioselectivity is decreased by an increase of SAS. Compound E6 was observed as outlier for this model.
Although all MLR models had statistically good r values (r > 0.8), unfortunately, only four QSARs also had acceptable predictivities (q2 = 0.50) [32]. This suggests the need of nonlinear modeling, e.g., by artificial neuronal networks (ANN). Relevant results obtained thereby are collected in Table 3. As expected, the resulting ANN-QSARs have improved values of r and all q2 score exceed the threshold for acceptability (q2 = 0.50), indicating a nonlinear dependence of log E on the descriptors used. This is especially evident for log E (C) and/or log E (E).
For log E (A), log E (B) and log E (F), the respective MLR models give better predictions, although two outliers (E19 and E21) in the MLR model for log E (A) can be included in the corresponding ANN model. Apparently, then, in case of these epoxide hydrolases, log E is essentially linearly dependent on the selected descriptors.

CONCLUSIONS

We have presented a quantitative structure – activity relationship study concerning the enantioselectivity observed for the enzymatic ring opening reactions of epoxides for a series of epoxide hydrolases from seven different organisms. Modeling has been done by multiple linear regression and artificial neuronal networks. Initially, a set of ca. 900 electronic and steric descriptors was used. Generally, a statistical meaningful modeling of log E values for all hydrolases can be obtained by as few as two or three descriptors. Notably, the enantioselectivity of the various hydrolases is modeled by different descriptors, indicating different steric and/or electronic requirements for the enantioselectivity in substrate binding.

REFERENCES

[1] Thomas, H., Oesch, F., ISI Atlas Sci.: Biochem. 1988, 287.
[2] (a) For the asymmetric chemo-hydrolysis: Ready, J. M., Jacobsen, E. N., Angew. Chem., Int. Ed. Engl., 2002, 41, 1347; Schaus, S. E., Brandes, B. D., Larrow, J. F., Tokunaga, M., Hansen, K. B., Gould, A. E.,. Furrow, M. E., Jacobsen, E. N., J. Am. Chem. Soc,. 2002, 124, 1307; (b) for the biohydrolysis see: Faber, K., Orru, R. V. A. in: Enzyme Catalysis in Organic Synthesis, Drauz, K., Waldmann, H. (eds.), 2nd edn., vol. II, pp. 579-608, Wiley-VCH, Weinheim, 2002.
[3] Archelas, A., J. Mol. Catal. B 1998, 5, 79-85.
[4] Weijers, C. A. G. M., de Bont, J. A. M., J. Mol. Catal. B 1999, 6, 199-214.
[5] Steinreiber, A., Faber, K., Curr. Opinion Biotechnol. 2001, 12, 552-558.
[6] Wandel, U., Mischitz, M., Kroutil, W., Faber, K., J. Chem. Soc., Perkin Trans. 1, 1995, 735; Mischitz, M., Kroutil, W., Wandel, U., Faber, K., Tetrahedron: Asymmetry, 1995, 6, 1261.
[7] Kroutil, W., Osprian, I., Mischitz, M., Faber, K., Synthesis 1997, 156; Osprian, I., Kroutil, W., Mischitz, M., Faber, K., Tetrahedron: Asymmetry, 1997,8, 65.
[8] Orru, R. V. A., Mayer, S. F., Kroutil, W., Faber, K., Tetrahedron, 1998, 54, 859.
[9] Krenn, W., Osprian, I., Kroutil, W., Braunegg, G., Faber, K., Biotechnol. Lett. 1999, 21, 687.
[10] Steinreiber, A., Osprian, I., Mayer, S. F., Orru, R. V. A., Faber, K., Eur. J. Org. Chem., 2000, 3703.
[11] Steinreiber, A., Hellström, H., Mayer, S. F., Orru, R. V. A., Faber, K., Synlett, 2001, 111.
[12] Hellström, H., Steinreiber, A., Mayer, S. F., Faber, K., Biotechnol. Lett. 2001, 23, 169.
[13] Osprian, I., Stampfer, W., Faber, K., J. Chem. Soc., Perkin Trans. 1, 2000, 3779-3785.
[14] Hult, K., Faber, K. in: Encyclopedia of Catalysis, I. T. Horvath (ed.), Wiley, New York, 2002, in press.
[15] Sybyl 6.8, Tripos Inc., St. Louis, MO, USA.
[16] Stewart, J. J. P., J. Comput.-Aid. Mol. Des., 1990, 4, 1.
[17] Dewar, M. J. S., Zoebisch, E. G., Healy, E. F., Stewart, J. J. P., J. Am. Chem. Soc., 107 (1985) 3902.
[18] Baker, J., J. Comput. Chem., 1986, 7, 385.
[19] DRAGON v1.1: Chemometrics and QSAR Research Group, Dipartimento di Scienze dell'Ambiente e del Territorio, Università degli Studi di Milano-Bicocca, Italy; available from http://www.disat.unimib.it/chum/Dragon.html
[20] Marzio, W. D., Galassi, S., Todeschini, R., Consolaro, F., Chemosphere, 2001, 44, 401.
[21] Stanton, D. T., Jurs, P. C., Anal. Chem., 1990, 62, 2323.
[22] Connolly, M. L., J. Mol. Graphics, 1993, 11, 139.
[23] Chem3D Ultra v 6.0, CambridgeSoft.Com, Cambridge, MA, U.S.A.
[24] Wold, S., Dunn, W.J., J. Chem. Inf. Comput. Sci., 1983, 23, 6.
[25]. STATISTICA for Windows. v. 5.5. StatSoft, Inc. (1995). Tulsa, OK, USA
[26] Cramer, R. D., Bunce, J. D., Patterson, D. E., Frank, I. E., Quant. Struct.-Act. Relat., 1993, 12, 367.
[27] Zupan, J., Gasteiger, J., Neural Networks in Chemistry and Drug Design: An Introduction; 2nd ed., Wiley-VCH: Weinheim, 1999.
[28] Suzuki, T., Ebert, R. –U., Schüürmann, G., J. Chem. Inf. Comput. Sci., 1997, 37, 1122.
[29] Dietrich, W. S., Dreyer, N. D., Hansch, C., J. Med. Chem., 1980, 23, 120.
[30] Cornish-Bowden, A., Wong, J. T., Biochem. J. 1978, 175, 969.
[31] Andrea, T. A., Kalayeh, H., J. Med. Chem., 1991, 34, 2824.
[32] C. H. Reynolds, M. K. Holloway, H. K. Cox, Eds.; ACS Symposium Series 589; American Chemical Society: Washington, DC, 1995; pp.64-81.


Scheme 1: Structures of Substrates for Epoxide Hydrolases


1 2 3
4 5 6
7 8 9
10 11 12
13 14 15
16 17 18
19 20 21
22 23 24


Table 1. Selected Quantum-chemical descriptors used in this study.


Descriptor 
Definition
qm+ maximum atomic charge in the molecule
qm- minimum atomic charge in the molecule
Qt total negative charge of the molecule
µ dipole moment
EHOMO HOMO molecular orbital energy
ELUMO LUMO molecular orbital energy
EN electronegativity = - (EHOMO + ELUMO)/2
H hardness = - (EHOMO - ELUMO)/2
DHf heat of formation
PPSA1 partial positive surface area
PPSA2 total charge weighted PPSA1
PPSA3 atomic charge weighted PPSA1
PNSA1 partial negative surface area
PNSA2 total charge weighted PNSA1
PNSA3 atomic charge weighted PNSA1
RPCG relative positive charge
RPCS relative positive charge surface area
RNCG relative negative charge
RNCS relative negative charge surface area
FPSA1 FPSA1=PPSA1 / total surface area
FPSA2 FPSA2=PPSA2 / total surface area
FPSA3 FPSA3=PPSA3 / total surface area
FNSA1 FNSA1=PNSA1 / total surface area
FNSA2 FNSA2=PNSA2 / total surface area
FNSA3 FNSA3=PNSA3 / total surface area
DPSA1 DPSA1=PPSA1 - PNSA1
DPSA2 DPSA2=PPSA2 - PNSA3
DPSA3 DPSA3=PPSA3 - PNSA1
WPSA1 WPSA1=PPSA1 * total surface area/1000
WPSA2 WPSA2=PPSA2 * total surface area/1000
WPSA3 WPSA3=PPSA3 * total surface area/1000
WNSA1 WNSA1=PNSA1 * total surface area/1000
WNSA2 WNSA2=PNSA2 * total surface area/1000
WNSA3 WNSA3=PNSA3 * total surface area/1000
MOLPROP PSA polar surface area (includes all O, N, S atoms and covalently bonded H's)
MOLPROP area total surface area 
MOLPROP PV polar volume (includes O, N, S atoms and covalently bonded H's)
MOLPROP Volume volume of molecule 
BO(C1-O3) bond order between unsubstituted carbon of epoxide and oxygen atom of epoxide
BO(C2-O3) bond order between substituted carbon of epoxide and oxygen atom of epoxide
E(C1) one-center energy of unsubstituted carbon of epoxide ring
E(C2) one-center energy of substituted carbon of epoxide ring
E(O3) one-center energy of oxygen atom of epoxide ring
E(C1-O3) two-center energy of bond between unsubstituted carbon and oxygen of epoxide ring
E(C2-O3) two-center energy of bond between substituted carbon and oxygen of epoxide ring
Alpha polarizability 
Betavec second order hyperpolarizabilizy along dipole moment
MolVol molecular volume 
Eel electrostatic energy
qC1 charge of epoxidic carbon atom
qC2 charge of chiral atom
qO3 charge of epoxidic oxygen atom
qC4 charge of 'free' carbon atom attached to the chiral centre
qC5 charge of the carbon atom included in the chain attached to the chiral centre


Table 2. Results of the MLR modelsa


log E Descriptorb
n
r
s
F
q2LOO
Outliers
A PPSA1 (-0.45), Ed (-0.76)
15
0.897
0.27
24.76
0.688
E5, E6, E19, E21, E22
B H (-0.69), Ev (0.744)
13
0.863
0.31
14.7
0.601
E11,E12
C FPSA1 (-0.31), SAS (-0.86)

Ed (-0.63)

17
0.808
0.41
8.1
0.348
E6
D nDB (0.86), SEV (0.64)
18
0.909
0.24
36.11
0.705
E2,E11,E17,E21
E EHOMO (0.78), MolPropPV (-0.49), ClogP (0.49), tor-O3C* (-0.49)
20
0.821
0.341
7.7
0.422
E2,E20,E22
F PPSA1 (-0.24), ClogP (-0.37)

Ed (-0.78)

16
0.953
0.230
39.6
0.823
E6,E19, E22
G MPROPAR (-0.21), MR (-0.65), tor-O3C* (-0.28)
18
0.822
0.358
9.8
0.472
not identified

a N – number of compounds; r - correlation coefficient, s - standard error, F-test, and crossvalidated correlation coefficients r2LOO.

b relative contributions in parentheses


Table 3. Results of ANN models using same set of descriptors for MLR models


Log E ANN's configuration 
n
r *
r
RMS
q2LOO
Outliers
A 2-2-1
17
1.89
0.892
0.277
0.502
E5, E6, E22
B 2-1-1
13
2.60
0.870
0.266
0.508
E11, E12
C 3-1-1
17
2.83
0.884
0.284
0.623
E6
D 2-2-1
20
2.22
0.832
0.298
0.506
E2, E11
E 4-1-1
20
2.86
0.890
0.272
0.598
E2, E19, E20
F 3-1-1
16
2.67
0.967
0.170
0.748
E6, E19, E22
G 3-1-1
18
3.00
0.841
0.340
0.528
not identified

*r = number of data points in the training set / sum of the number of connections in the ANN